In September 2013 the IPCC published its Fifth Assessment Report (AR5) from Working Group I. Chapter 7 of this report reviewed evidence on links between aerosols and clouds and arrived at a best estimate for total anthropogenic aerosol forcing of -0.9Wm-2. This caused a bit of a stir because it seemed like a fairly large change from the -1.2Wm-2 central estimate from assessed aerosol influences in the 2007 AR4, and the smaller negative number would tend to imply lower climate sensitivity based on simple energy balance calculations.
It caused a bit of a stir, but probably would have been a much bigger stir had the Chapter 7 second order draft (SOD) not been leaked in December 2012 with this -0.9 best estimate already in place. Numerous climate-related blogs and even popular science publications carried reports of this change at the time. Scientists involved with other AR5 chapters also took notice. In the SOD review comments, Reto Knutti, a contributing author on Chapter 10, references the smaller aerosol forcing estimate and possible implications for climate sensitivity:
There is a potential inconsistency between the estimated total forcing, climate sensitivity and the observed ocean and surface warming. A large part of this is related to the aerosol total forcing estimated to be much smaller than in AR4. If all the forcing numbers are taken at face value, the observed warming implies a climate sensitivity of 2K or less, which is inconsistent with CMIP5, and which would imply much smaller warming in the future. This potential inconsistency needs to be checked, and if real its implications need to be discussed in one of the chapters. [Reto Knutti, Switzerland]
Shortly afterwards Otto et al. 2013 was rushed to publish so it could feature in the Chapter 10 assessment of climate sensitivity estimates. Among the co-authors was the aforementioned Reto Knutti and Nicholas Lewis, who had been blogging about implications of the leaked estimate. Chapter 7 lead authors Bjorn Stevens and Ulrike Lohmann were also involved. Otto et al. 2013 was then used to support a lowering of the assessed likely Equilibrium Climate Sensitivity (ECS) range to 1.5-4.5ºC, which had previously remained at 2-4.5ºC in the SOD.
After all that, heading into the final draft, probably the Chapter 7 authors wouldn’t have been able to change the -0.9 best estimate even if they wanted to. Is there any reason they might have wanted to, you ask? The SOD justifies the assessment as follows:
We produce a best estimate and 5–95% uncertainty range for AFari+aci in the following way. The global CMIP5 models and inverse estimates are grouped together and a bootstrapping method is used to estimate a mean and standard deviation of –0.98 and 0.32 W m–2. Processing the satellite-based estimates in the same way leads to a mean and standard deviation of–0.73 and 0.30 W m-2, respectively, with the caveat that the method applied to a small sample may underestimate the variance. We combine these two estimates into a best estimate and a 5 to 95% range for RFari+aci of –0.9 (–1.5 to –0.3) W m–2, accounting for a small 1850 of 1750 correction term.
The problem here is that the -0.73 figure, representing the average of satellite-based estimates, was badly wrong. Most of the satellite studies only reported on a subset of aerosol-cloud indirect effects but were included as if they were total aerosol forcing estimates.
At the time I pointed out that this could be improved by simply dropping in the IPCC ari (aerosol-radiation interaction, or ‘direct effect’) estimate where none was given by the study, along with other smaller adjustments to make a like-for-like IPCC forcing estimate. There were some ambiguities in the papers themselves and some semi-subjective judgements to make and I ultimately arrived at a range of -1.2 to -1Wm-2 for the satellite estimate average. A blogger, PaulB, also took up the challenge and independently assessed the same studies, arriving at an average of -1.1Wm-2.
Most of the model and inverse estimates refer to 1850 as pre-industrial so require a small correction to be compatible with the IPCC’s 1750 reference frame. That would bring both satellite and combined inverse & model estimates to about -1.1Wm-2 so the corrected best estimate would have to be -1.1Wm-2.
Taking it at face value that the Chapter 7 SOD would have reported -1.1Wm-2 if they’d done their sums right it’s interesting to note the knock on consequences of that simple error. -1.1Wm-2 probably wouldn’t have caused such a splash on the blogosphere. Otto et al. 2013 may never have been published. The likely sensitivity range may have remained 2-4.5ºC.
Final Draft
So, how did we end up with the best estimate remaining at -0.9Wm-2 in the final report despite this clear error in the SOD?
Essentially, the quoted SOD method was scrapped. They did indeed fix the satellite estimate error by filling in the gaps, but more on that in a bit. Inverse estimates were discarded, as were CMIP5 model forcings. The formulation of the estimate and range was described as an expert judgement based on the best, most fully-featured, aerosol models and satellite-based observational constraint studies (see Table 7.4, reproduced below).
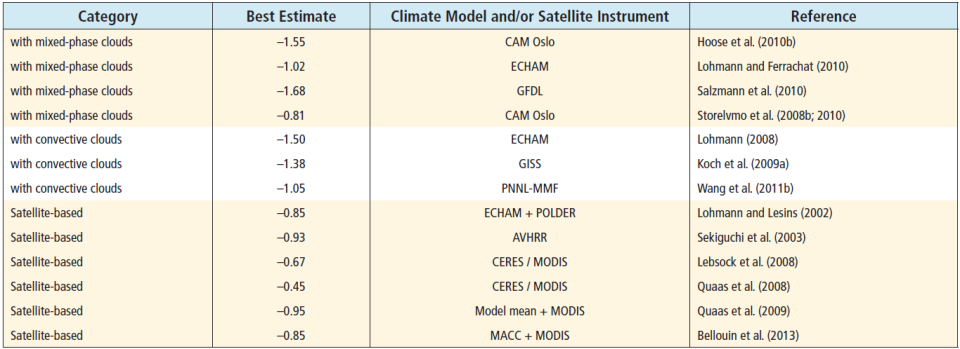
IPCC AR5 Chapter 7 Table 7.4
In practice it seems that the best estimate was strongly weighted towards the satellite study average, which ended up as -0.85Wm-2 compared with the featured model average of about -1.4Wm-2. That’s more negative than the SOD satellite average but short of my expected -1.2 to -1 range, so was my assessment in error? I think a few of the choices made by the IPCC authors are questionable and tend towards the least negative end of a reasonable range. In Appendix A I assess those choices and alternatives. However, a key factor was the addition of a +0.2Wm-2 longwave contribution, which did not feature in any previous draft, described as follows:
Likewise, those (all but one) studies that only accounted for changes in shortwave radiation when computing ERFaci were corrected by adding a constant factor of +0.2 W m–2, taken from the lower range of the modeled longwave effects which varied from +0.2 to +0.6 W m–2 in the assessed models.
Longwave?
This is a bit of a mystery. Satellite observational studies tend to only report shortwave estimates, so it makes sense to include some kind of longwave contribution for completeness, but this +0.2 number isn’t prefigured anywhere in the chapter and there are no clues to indicate what ‘the assessed models’ are, let alone why those were the assessed models. Given their stated role in the assessment it would make sense if the models were those listed in Table 7.4, but these do not support a +0.2 to +0.6 range. From those which report relevant longwave forcing figures I get a range of -0.3 to +0.3 (see Table 2 below). Zelinka et al. 2014 reports on longwave forcing from nine CMIP5 models, with a range of -0.23 to +0.95, averaging at +0.22. One of the satellite-based studies (Quaas et al. 2009) listed a set of aerosol models and their longwave forcings, with a range of -0.19 to +0.45 and average about 0.2Wm-2. These figures could perhaps support an average model longwave forcing of +0.2, but not +0.2 as the low end of the range.
Taking the low end of a model range is probably correct since the size of longwave forcing typically correlates with the size of shortwave forcing and the assessed satellite study average for shortwave forcing of -1.05Wm-2 puts it at the low end of model ranges. Figure 1 shows the relationship between longwave and shortwave forcing in the model collections discussed above.
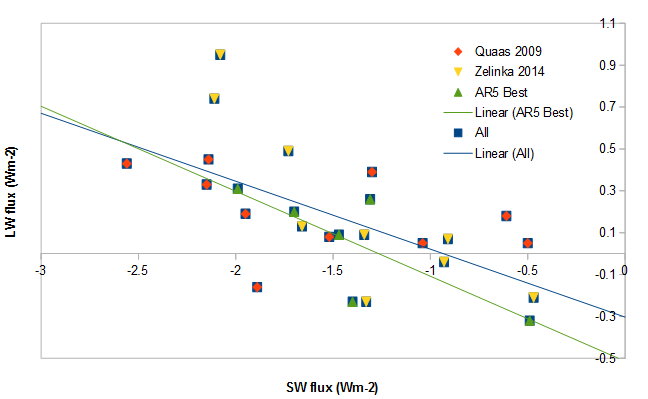
Figure 1. Correlation between shortwave and longwave aerosol forcing in various models
The best fit for SW = -1.05 is about +0.04 Wm-2 for All results but -0.08 for those designated Best models by AR5. Plotting the axes the other way around results in a best fit around -0.18 Wm-2 in both All and Best.
It looks like the stated +0.2 to +0.6 range cannot originate from what would be considered the most obvious sources. But I want to go back to a question raised earlier. Physically, what are they suggesting is producing this longwave forcing? It’s been determined that mixed-phase and ice cloud aerosol interactions could produce positive longwave forcing (e.g. Ghan et al. 2012), but also shortwave forcing. Since none of the satellite studies address mixed-phase clouds at all, it would seem inappropriate to add a longwave figure for this process without a shortwave one. Furthermore, the Table 7.4 model studies which include mixed-phase cloud interactions do not seem to clearly support a positive longwave cloud forcing. Three out of four report relevant numbers and the average comes to -0.12Wm-2. Ghan et al. 2012 may actually be the source of the 0.2 to 0.6 range. It reports results from three setup variants in the same model and total longwave ranges from +0.27 to +0.54Wm-2. Rounding down and up gives a range 0.2 to 0.6. However, shortwave forcing in each model variant is -2.0Wm-2, much larger than the AR5 assessed value. Indeed, a longwave forcing range of +0.2 to +0.6Wm-2 fits well with a shortwave forcing of -2.0Wm-2 in the correlation plot above.
Conclusions and Discussion
Based on multi-model LW/SW correlations, I would suggest a best estimate longwave contribution of 0.0Wm-2. Plugging into the satellite estimates shifts mean and median total aerosol forcing only to -0.9Wm-2. Using alternative reasonable choices in assessing the satellite studies, as outlined in Appendix A, suggests mean and median of -1.1Wm-2.
One thing worth consideration is that half of the satellite studies produce a shortwave estimate for only the first indirect effect, range -0.2 to -0.5Wm-2 (taking into account 1750 correction for Bellouin et al. 2013). For those which produce an estimate including further aci effects the shortwave total is -0.7 to -1.4Wm-2. While the sample size is small it suggests studies addressing only the first indirect effect underestimate the magnitude of the total shortwave aci effect. Sekiguchi et al. 2003 is the only satellite-based study to report separate estimates for different aci processes. It actually reports a relatively small first indirect effect, similar to Quaas et al. 2008 but total SW aci comes to -1.4Wm-2. This suggests it is unwise to put so much weight on estimates of first indirect effect only, without consideration of a probable bias.
I would like to emphasise that the purpose of this article was an assessment of the justifications provided by the Chapter 7 authors. I’ve determined that the SOD reported best estimate was clearly wrong and the final report is unclear. If the best estimate is simply a straightforward adoption of the satellite-based studies and a model longwave figure I would suggest their -0.9 is at the low (least negative) end of a reasonable range based on available assessment choices. However, perhaps the authors had good reasons for going with -0.9Wm-2 as a best estimate, based on a deep-level understanding of biases in modelling and measurement systems or directions that avenues of research tended to be pointing. Perhaps they didn’t feel able to communicate this, either due to readability constraints (the IPCC report is intended to be readable by non-specialists) or time constraints.
The question then is whether it is representative of consensus of opinion in the aerosol community, answering which would probably require some kind of survey. Morgan et al. 2006 conducted such a survey of 24 active scientists in this area. Only two indicated a personal best estimate less negative than -1 Wm-2 and those were both at the low-end of self-reported expertise on the matter. Personal best estimates strongly clustered in the -1.5 to -1Wm-2 region, though with typical uncertainty ranges of about -2.5 to -0.3Wm-2. The problem here is that this was taken nearly ten years ago (although “only” seven years prior to AR5 publication), so things may have changed. The SOD review comments may provide some indication of community support for the best estimate. While I wouldn’t say there were strongly negative reactions, some comments did question the justification for the less negative estimate and lower uncertainty range (Note the range was widened from -1.5 to -0.3Wm-2 in the SOD to -1.9 to -0.1Wm-2 in the final report).
There’s also a question over whether even giving a single-point best estimate, implying a normal distribution probability function, provides a good representation of the level of understanding, which is still ‘Low’ in AR5 for aerosol-cloud interactions. The zeroth and first order drafts only provided likely and very likely ranges, no best estimates. It was only after Coordinating Lead Author of Chapter 8, Gunnar Myhre, asked for a best estimate that it was introduced in the SOD, presumably to comply with the format of Chapter 8. I can find no compelling reason in aerosol literature why -0.9Wm-2 is substantially more likely than, say, -1.3Wm-2, which is difficult to reconcile with a normal distribution uncertainty profile centering on -0.9.
It seems like -0.9Wm-2 is probably within the range of general expert opinion, but at the least negative end, whereas something around -1.3Wm-2 may have roughly equal support.
Appendix A
In the following I go through the treatments of the satellite-based studies, highlight what was done with alternatives. In most cases the choices made pushed the estimate towards less negative values.
Lohmann and Lesins 2002 (pdf)
- Study Type: Observational scaling of model
- Published component estimates
Base Model TotalSW = -1.8Wm-2
Base Model TotalLW = +0.4Wm-2
includes ari of around -0.1Wm-2 (Ref. Quaas et al. 2006)
Obs. Scaled TotalSW = -1.1Wm-2
Obs. Scaled TotalLW = +0.25Wm-2
Obs. Scaled TotalNet aci+ari = -0.85Wm-2 - AR5 assessed estimate
TotalNet aerosol forcing aci+ari = -0.85Wm-2 - Comments
Appear to have used the published estimate unadjusted as total aerosol forcing. That means this satellite estimate includes a non-observationally informed ari estimate less negative than -0.1Wm-2. - Alternative
Replace ari with AR5 estimate. Total aerosol forcing = -1.25Wm-2
Sekiguchi et al. 2003 (pdf)
- Study Type: Correlation
- Published component estimates
First and Second indirect effects SW = -0.68Wm-2
Cloud fraction effect SW = -0.73Wm-2
TotalSW aci = -1.4Wm-2
Cloud Top LW effect maximum = +0.87Wm-2
Total aci range = -0.6 to -1.2Wm-2
ari over ocean = -0.4Wm-2 - AR5 assessed estimate
TotalNet aerosol forcing aci+ari = -0.93Wm-2 - Comments
Appear to have taken aci as TotalSW (-1.4) + Cloud Top LW (0.87), even though 0.87 was specified to be a ‘maximum possible’ figure, not a best estimate. -0.4 used for ari. Since stated ari only for ocean, could have chosen to drop in AR5 estimate for global ari. - Alternative
Use centre of stated Total aci range = -0.9Wm-2
Total aerosol forcing inc. AR5 ari = -1.35Wm-2
Lebsock et al. 2008 (pdf)
- Study Type: Correlation
- Published component estimates
First indirect effect SW = -0.42Wm-2 - AR5 assessed estimate
TotalNet aerosol forcing aci+ari = -0.67Wm-2 - Comments
Only first indirect effect estimated.
AR5 ari dropped in. LW +0.2Wm-2 added - Alternative
Using SW/LW correlation, LW = -0.05Wm-2. Could add a contribution from other aci processes but not sure about a figure.
TotalNet aerosol forcing = -0.92Wm-2
Quaas et al. 2008 (pdf)
- Study Type: Correlation
- Published component estimates
First indirect effect SW = -0.2Wm-2
ari SW = -0.9Wm-2 - AR5 assessed estimate
TotalNet aerosol forcing aci+ari = -0.45Wm-2 - Comments
Only first indirect effect estimated.
AR5 ari dropped in even though an observational estimate is given. ari estimate relates to total anthropogenic influence rather than change from 1750. Scaling to -0.7Wm-2 for 1750 should be about right. - Alternative
Using SW/LW correlation, LW = -0.05Wm-2.
Also could add contribution for other aci processes.
Using scaled given ari, Total aerosol forcing = -0.95Wm-2
Quaas et al. 2009 (pdf)
- Study Type: Observational scaling of model
- Published component estimates
Method 1: Scaling of total SW aci+ari forcing by correlating relevant observed properties against model properties = -1.5Wm-2 for total aerosol aci+ari forcing.Method 2: Split into cloudy sky and clear regions for separate analysis, as approximation for aci and ari effects respectively.
Scaled cloudy-sky = -0.7Wm-2
Scaled clear-sky = -0.4Wm-2
Scaled full global field = -1.15Wm-2 - AR5 assessed estimate
TotalNet aerosol forcing aci+ari = -0.95Wm-2 - Comments
AR5 takes Method 2 global field directly and adds +0.2Wm-2 longwave. - Alternatives
Could have used Method 1 or a combination, though the text does state Method 2 is ‘probably more reliable’.
Using SW/LW correlation, LW = 0Wm-2, Total aerosol forcing = -1.15Wm-2
Bellouin et al. 2013 (pdf)
- Study Type: Correlation
- Published component estimates
ari from anthropogenic vs. natural = -0.7Wm-2
ari from pre-industrial (1860) = -0.4Wm-2
First indirect effect from anthropogenic vs. natural = -0.6Wm-2 - AR5 assessed estimate
TotalNet aerosol forcing aci+ari = -0.85Wm-2 - Comments
Only first indirect effect of aci estimated.
Not clear exactly how ended up as -0.85. Presumably some combination of adjustments to account for 1750 timescale. Probably not unreasonable.
+0.2Wm-2 longwave added.
The author group and method are essentially the same as Quaas et al. 2008. According to the Chapter 7 text this should have superseded Quaas et al. 2008 rather than both being included as independent estimates. - Alternatives
Using SW/LW correlation, LW = 0Wm-2, Total aerosol forcing = -1.05Wm-2
